Overview of Amazon’s Macro Data
1. Traffic Data
- In July 2023, Amazon’s global website traffic reached 2.79 billion visits, up from 2.5 billion in June 2023, reflecting a 10.6% year-over-year increase.
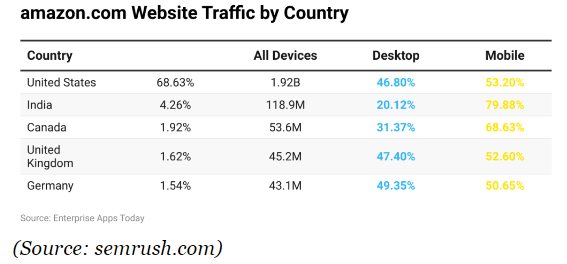
- Over the past six months, Amazon saw the highest number of global visits from mobile devices, reaching 1.2 billion (55.6% of total traffic), while desktop visits accounted for 1.5 billion (44.4%).
- The United States remains Amazon’s largest traffic source, followed by India and Canada.
- By 2024, Amazon’s traffic is expected to surpass Walmart’s, making it the leader in the U.S. market.
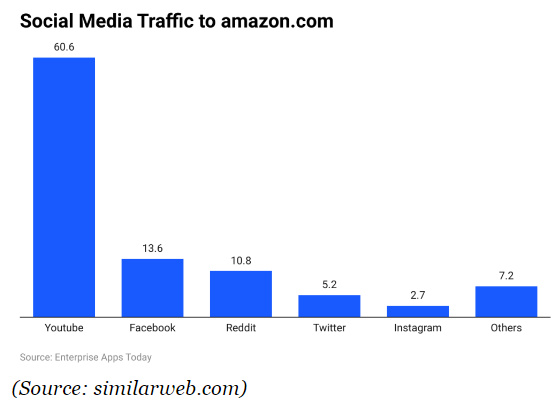
Social Media Traffic Sources
- The top three social media traffic sources directing visitors to Amazon are:
- YouTube (59.64%)
- Facebook (14.80%)
- Reddit (9.61%)
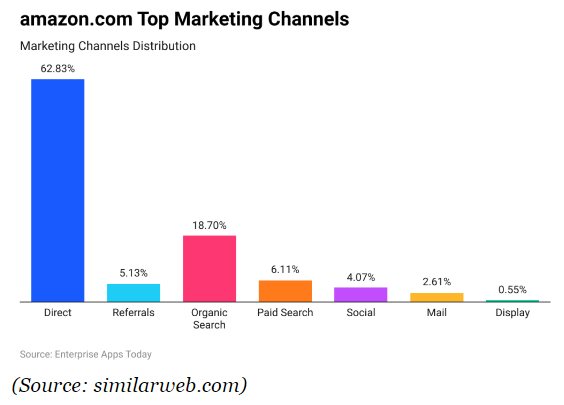
- Amazon’s traffic distribution breakdown:
- Direct traffic: 62.83%
- Organic search: 18.70%
- Paid search: 6.11%
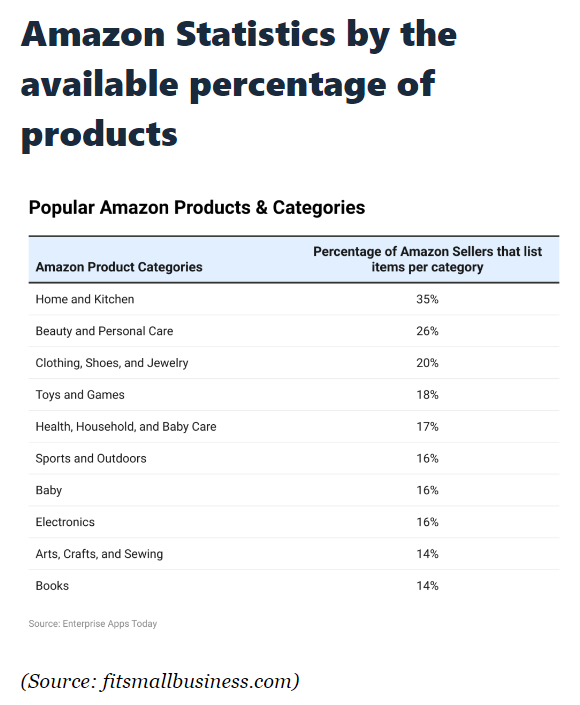
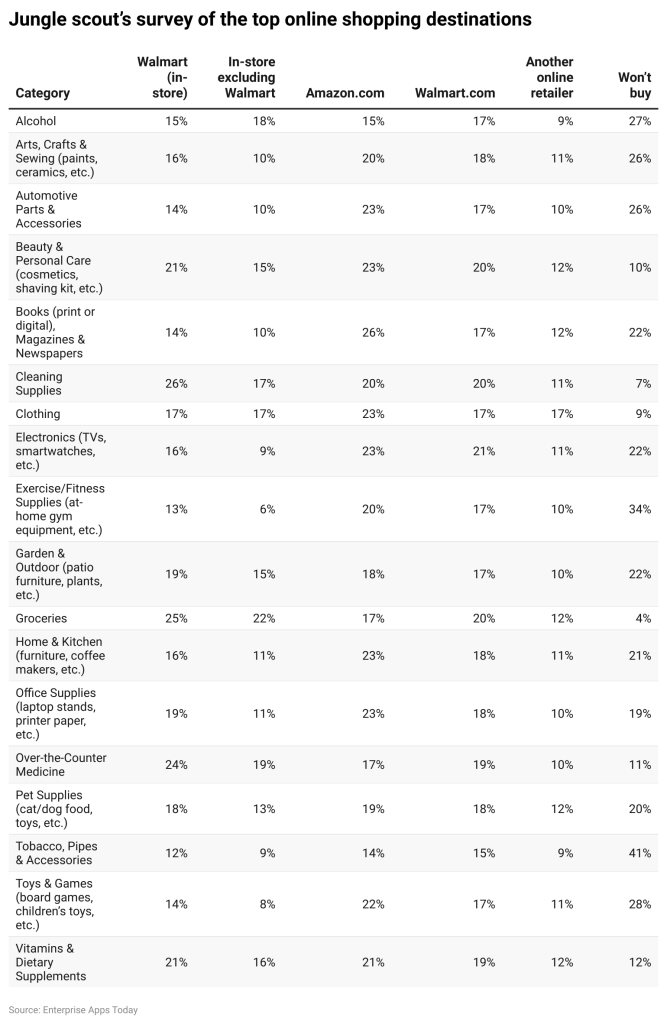
2. Product Category Data
- As of 2023, the top three product categories with the widest supply range are:
- Home & Kitchen (35%)
- Beauty & Personal Care (26%)
- Apparel, Shoes & Jewelry (20%)
- Categories with fewer products include:
- Electronics (16%)
- Arts, Crafts & Sewing (14%)
- As of March 2023, Amazon was recognized as one of the world’s most valuable e-commerce brands. Amazon holds over 90% market share in several product categories, including:
- Skincare (91%)
- Golf-related products (92%)
- Home improvement tools (93%)
- Kitchen & dining products (94%)
- Batteries (97%)
Brand, Seller, and Consumer Behavior Statistics
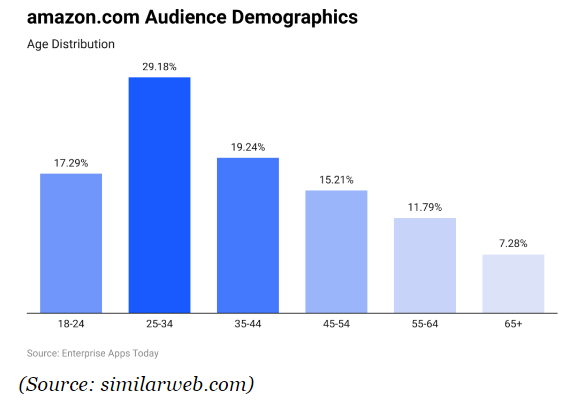
1. Consumer Demographics
- The largest age group of Amazon consumers falls between 25 and 34 years old (29.18%). Other key age groups include:
- 35 to 44 years old: 19.24%
- 18 to 24 years old: 17.29%
- 65+ years old: 7.28%
- The most preferred shopping categories among consumers include:
- Home & Kitchen
- Office Supplies
- Apparel
- Electronics
- Beauty & Personal Care
- Automotive Parts
- These categories collectively make up 23% of consumer preferences.
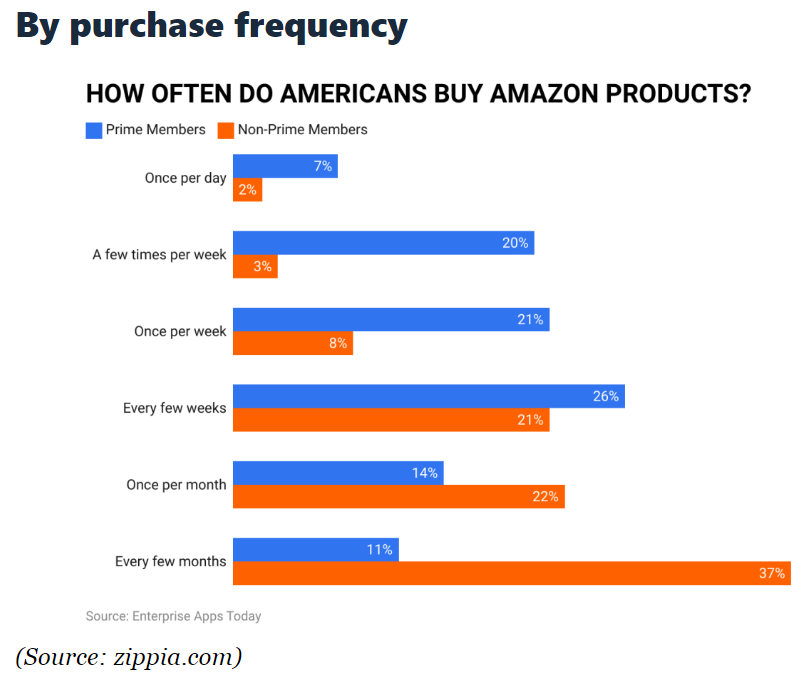
2. Consumer Behavior Data
- In the U.S. market, Amazon Prime membership has surpassed 172 million users.
- In Q1 2023, approximately 26 million consumers opted for same-day delivery, a 50% increase from the previous year.
- Pre-purchase behavior:
- 90% of consumers check Amazon for price comparisons before purchasing a new brand.
- 50% of consumers are willing to purchase unknown brands from Amazon.
- Brand preferences:
- 76% of consumers are more likely to purchase private-label brands available on Amazon.
- 38% of consumers find search ads helpful.
- Conversion & shopping preferences:
- Amazon’s average order conversion rate ranges from 12% to 13%.
- 89% of online shoppers prefer Amazon over other e-commerce websites.
- 66% of consumers favor Amazon because they can find everything they need on one platform.
- 90% of consumers are satisfied with Amazon’s customer service.
3. Seller & Brand Data
- The majority of Amazon’s third-party sellers are based in:
- United States (68.9%)
- China (27.0%)
- Hong Kong (2.1%)
- Amazon processes a high volume of orders daily:
- One order is shipped every 18.5 seconds.
- 66,000 orders are shipped per hour.
- 1.6 million orders are shipped per day.
- Fulfillment & advertising:
- In 2022, 64% of sellers used Fulfillment by Amazon (FBA).
- 59% of brands spent over $60,000 per month on Amazon advertising.
- Cross-platform selling:
- 80% of Amazon sellers also sell on other e-commerce platforms.
- Amazon has over 6.4 million registered sellers worldwide, with 1.5 million active sellers.
- An average of 3,700 new sellers register on Amazon daily.
- Prime & revenue distribution:
- 83% of Amazon sellers use Prime shipping.
- Monthly revenue breakdown:
- 27% of sellers earn between $1,000 and $5,000 per month.
- 22% of sellers earn below $500 per month.
- Only 1% of sellers report monthly earnings between $100,000 and $250,000.
Please follow and like us: